
|
|
|
Mobile Marketing Statistics 2012
Mobile marketing is on the rise. We’ve been collecting some of the latest mobile marketing statistics that reflect the growth and importance of mobile as a channel for reaching people. Feel free to use any stats with attribution to the sources listed (and maybe a link to this page if you like).
Have cool mobile marketing statistics? A correction to a source listing? Send it over: team@snaphop.com.
Mobile Usage StatisticsIn 2011, there were 835 million smartphone users, 5.6 billion feature phone users (Mary Meeker, Kleiner Perkins, Morgan Stanley Research via Business Insider)
Global internet usage will more than double by 2015, and most of these users will be mobile (Boston Consulting Group, Mary Meeker, Kleiner Perkins, Morgan Stanley Research, Berg Insight viaBusiness Insider)
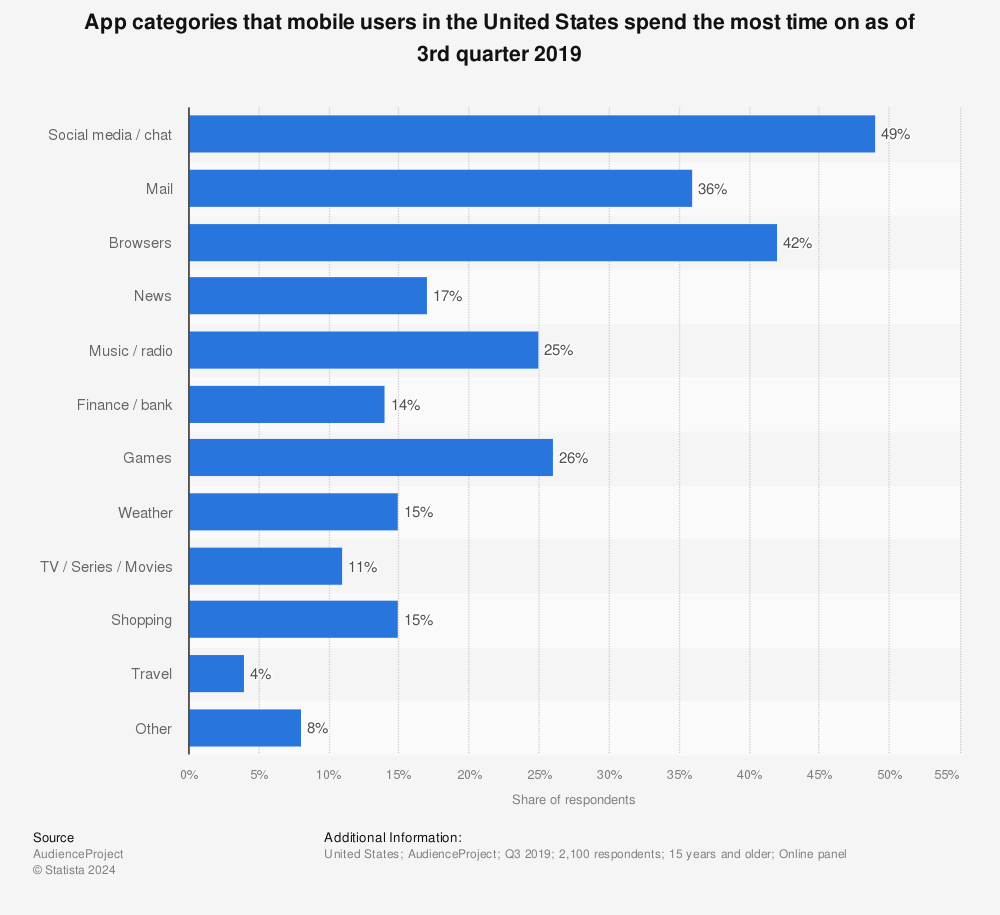
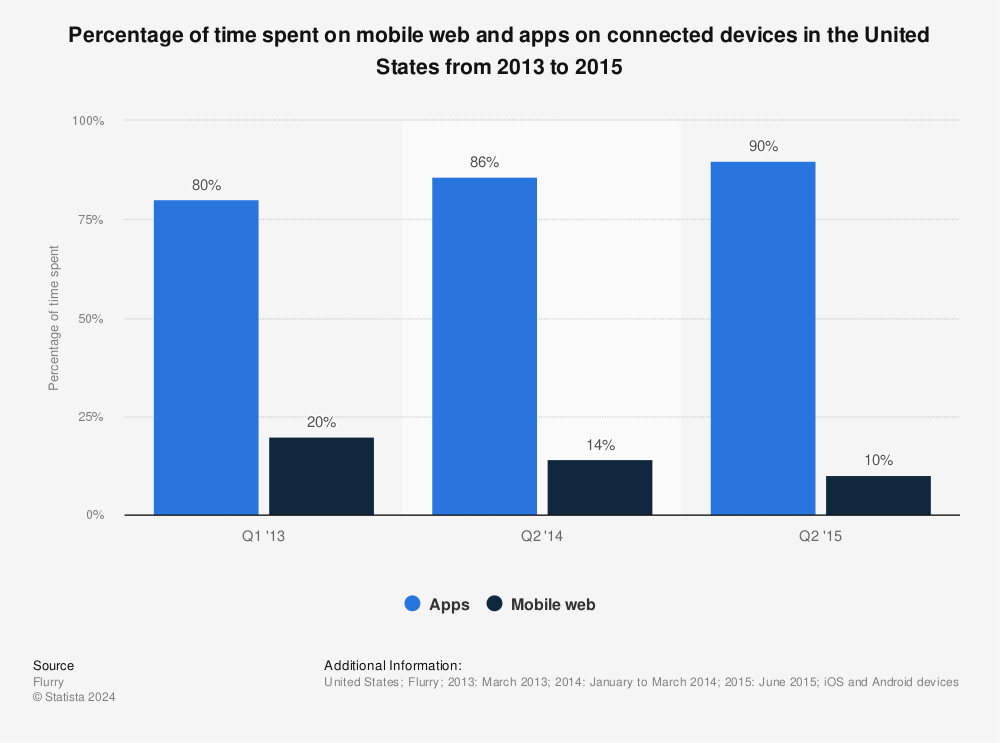
64% of mobile phone time is spent on apps (Nielsen 2012)
13.4% texting, 11.1% browser, 5.5% social networking apps, 5.4% dialer, 5.3% email/IM, 2.3% music/video, 1.1% camera, 55.8% other apps (Nielsen 2012)
Adults spend more media time on mobile than newspapers and magazines combined (eMarketer December 2011)
On average, it takes 90 minutes to respond to an email, but 90 seconds to respond to a text message (CTIA)
61% of customers who visit a mobile unfriendly site are likely to go to a competitor’s site (Karim Temsamani at IABALM 2012 via IAB)
At the end of 2011, nearly 1 in 5 smartphone users scanned product barcodes and nearly 1 in 8 compared prices on their phones while in a store (comScore 2012)
In 2012, the U.S. saw a 55% increase in smartphone subscriptions to make for 98 million smartphone subscribers, representing nearly 42% of all U.S. mobile users. (comScore 2012)
In the U.S. alone, there were more than 400 smartphone devices on the market at the end of 2011 (comScore 2012)
In 2011, smartphone adoption increased 99% among 6-person households, 98% among those making less than $25,000, and 92% among retirees (comScore 2012)
Apple and Android represent more than 75% of the smartphone market (comScore 2012)
QR code scans increased 300% in 2011 over 2010 (ScanLife)
QR code usage jumped 617% from January to December 2011 in top 100 magazines (Nellymoser)
Mobile email opens increased 34% while opens on webmail and PCs decreased by 11% and 9.5% from April to September 2011 (Return Path)
Local Search61% of smartphone users make local searches from a device (Localeze/15miles Fifth Annual comScore Local Search Usage Study February 2012)
49% of mobile and tablet users conduct local business searches on apps (Localeze/15miles Fifth Annual comScore Local Search Usage Study February 2012)
Mentioning a location in an ad or search result can increase click-through rates up to 200% (ThinkNear 2012 via MediaPost)
20% of telecom, 30% of restaurant, and 25% of movie searches are mobile (Google)
Mobile Web vs. Mobile Apps127.6 million mobile users in the U.S. and 108 million users in Europe consumed mobile media through their mobile browser or application in 2011, about a 30% increase over 2010 (comScore 2012)
In December 2011, 47.6% of the total mobile audience in the U.S. used apps, 47.5% used mobile browsers; in Europe, 38.2% of the total mobile audience accessed mobile media via application, 38.1% used browsers (comScore 2012)
81% of users prefer mobile sites to apps for price research, 79% for product reviews, 63% for purchasing (Adobe Mobile Experience Survey & eMarketer 2011 via SearchEngineLand)
Mobile Marketing StrategiesTop mobile marketing objective: increase customer engagement (52% of surveyed; Forrester July 2010)
Mobile Marketing RevenueU.S. mobile & social media revenue - including consumer and business access, content, advertising and marketing - increased 30.2% to $45.38 billion in 2011. (PQ Media via Mobile Marketing Watch)
Mobile content and access had revenues of $39.17 billion in 2011, up 27.8% from 2010. Of that $39.17 billion, business accounted for 58% of the total and consumer for 42%. (PQ Media January 2012 via MarketingProfs)
Online social media was the smallest sector of mobile and social media during the year, reaching $2.83 billion in revenues, but the category grew at a very strong 42.1% year over year. Within the online social media category, social networking was the largest and fastest-growing segment by far, increasing 45.9%, to $2.28 billion in 2011. (PQ Media January 2012 via MarketingProfs)
From 2006 to 2011, mobile and social media revenue rose at a compound annual growth rate of 28.7%. (PQ Media January 2012 via MarketingProfs)
Total US mobile and social media revenues-including business and consumer content, access, and advertising and marketing-reached $45.38 billion in 2011, up 30.2% from a year earlier (PQ Media January 2012 via MarketingProfs)
Mobile CommerceMore than half of the U.S. smartphone population used their phone to perform retail research while inside a store in 2011 (comScore 2012)
79% of smartphone users use their phones to help with shopping and 74% make a purchase as a result (Google/Ipsos 2010)
More than half (52%) of adult cell phone owners used their devices while in a store to get help with purchasing decisions. (Pew 2011 via MediaPost)
It takes over 10 sessions with an app for 44% of eventual buyers to make their first purchase. Only a third (33%) buy in 2 to 9 uses of an app. And only 22% actually accept an upsell opportunity the first time in the door (Localytics via MediaPost January 2012)
Overall, about a third of cell phone owners used their phone within the past 30 days to look up either product reviews or prices online while in the store. Of them, 35% decided to purchase the item in the store, while 19% decided to purchase the product online and 37% opted not to purchase the product at all. (Pew Research Center via MediaPost)
Mobile payments are expected to quadruple to $630 billion by 2014 (Juniper Research)
42% of mobile users browsed products, 32% read online reviews, and 23% purchased products on mobile in the last 30 days (Nielsen Smartphone Analytics December 2011)
39% of store walkouts, where consumers leave without buying, were influenced by smartphones (Motorola Solutions)
Mobile and TravelMobile was responsible for US $2.6 billion in travel booking value in 2011. By 2013, than number is projected to exceed $8 billion, representing 2.6% of all U.S. travel bookings and 6.5% of the total online travel market. (PhoCusWright January 2012)
Mobile Marketing GrowthTotal US mobile and social media revenues-including consumer and business access, content, advertising and marketing-is expected to grow 30.8% year over year in 2012 (PQ Media January 2012 via MarketingProfs)
Mobile advertising and marketing was the fastest-growing sector in 2011, expanding 53.7% year over year to $3.39 billion with the ad segment soaring 60.9% and the marketing segment expanding 46.2% during the year (PQ Media January 2012 via MarketingProfs)
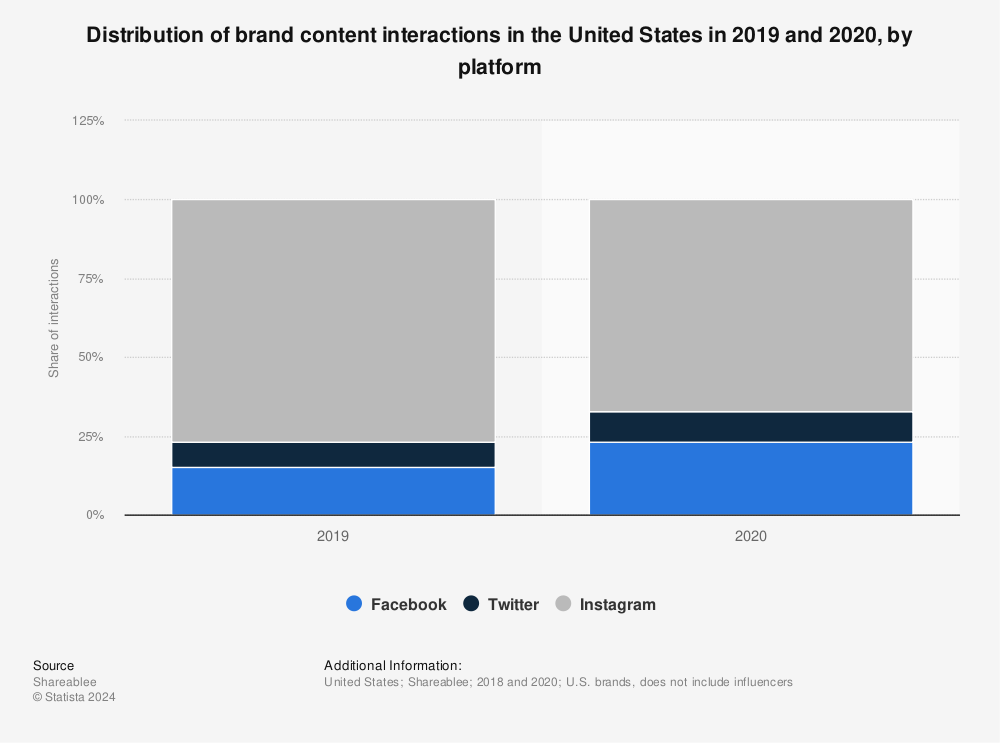
(Mobile) AdvertisingFacebook delivers 1 of every 4 online display ads (comScore 2012)
The global mobile ad market will grow from $3.4 billion in 2010 to $22.0 billion in 2016 (Berg Insight via B2B)
40% of males ages 18 to 29 like mobile ads “somewhat” or “very much” (eMarketer)
US mobile ad spend to reach $2.6B in 2012 (eMarketer)
Tablet owners more likely to purchase from online ads than smartphone owners, also more likely to request coupons from merchant (Nielsen)
Text message and online display ads have the lowest consumer trust (26% and 27%, respectively), while websites and TV have the highest (52% and 46%, respectively). (Nielsen)
Social Media & General Marketing36% of tweets are worth reading, 39% are mediocre, and 25% are not worth reading at all (MarketingProfs March 2012)
21% of Pinterest users purchased a product after seeing a picture on Pinterest (PriceGrabber 2012 via MediaPost)
Have cool mobile marketing statistics? A correction to a source listing? Send it over: team@snaphop.com.
Mobile Usage StatisticsIn 2011, there were 835 million smartphone users, 5.6 billion feature phone users (Mary Meeker, Kleiner Perkins, Morgan Stanley Research via Business Insider)
Global internet usage will more than double by 2015, and most of these users will be mobile (Boston Consulting Group, Mary Meeker, Kleiner Perkins, Morgan Stanley Research, Berg Insight viaBusiness Insider)
64% of mobile phone time is spent on apps (Nielsen 2012)
13.4% texting, 11.1% browser, 5.5% social networking apps, 5.4% dialer, 5.3% email/IM, 2.3% music/video, 1.1% camera, 55.8% other apps (Nielsen 2012)
Adults spend more media time on mobile than newspapers and magazines combined (eMarketer December 2011)
On average, it takes 90 minutes to respond to an email, but 90 seconds to respond to a text message (CTIA)
61% of customers who visit a mobile unfriendly site are likely to go to a competitor’s site (Karim Temsamani at IABALM 2012 via IAB)
At the end of 2011, nearly 1 in 5 smartphone users scanned product barcodes and nearly 1 in 8 compared prices on their phones while in a store (comScore 2012)
In 2012, the U.S. saw a 55% increase in smartphone subscriptions to make for 98 million smartphone subscribers, representing nearly 42% of all U.S. mobile users. (comScore 2012)
In the U.S. alone, there were more than 400 smartphone devices on the market at the end of 2011 (comScore 2012)
In 2011, smartphone adoption increased 99% among 6-person households, 98% among those making less than $25,000, and 92% among retirees (comScore 2012)
Apple and Android represent more than 75% of the smartphone market (comScore 2012)
QR code scans increased 300% in 2011 over 2010 (ScanLife)
QR code usage jumped 617% from January to December 2011 in top 100 magazines (Nellymoser)
Mobile email opens increased 34% while opens on webmail and PCs decreased by 11% and 9.5% from April to September 2011 (Return Path)
Local Search61% of smartphone users make local searches from a device (Localeze/15miles Fifth Annual comScore Local Search Usage Study February 2012)
49% of mobile and tablet users conduct local business searches on apps (Localeze/15miles Fifth Annual comScore Local Search Usage Study February 2012)
Mentioning a location in an ad or search result can increase click-through rates up to 200% (ThinkNear 2012 via MediaPost)
20% of telecom, 30% of restaurant, and 25% of movie searches are mobile (Google)
Mobile Web vs. Mobile Apps127.6 million mobile users in the U.S. and 108 million users in Europe consumed mobile media through their mobile browser or application in 2011, about a 30% increase over 2010 (comScore 2012)
In December 2011, 47.6% of the total mobile audience in the U.S. used apps, 47.5% used mobile browsers; in Europe, 38.2% of the total mobile audience accessed mobile media via application, 38.1% used browsers (comScore 2012)
81% of users prefer mobile sites to apps for price research, 79% for product reviews, 63% for purchasing (Adobe Mobile Experience Survey & eMarketer 2011 via SearchEngineLand)
Mobile Marketing StrategiesTop mobile marketing objective: increase customer engagement (52% of surveyed; Forrester July 2010)
Mobile Marketing RevenueU.S. mobile & social media revenue - including consumer and business access, content, advertising and marketing - increased 30.2% to $45.38 billion in 2011. (PQ Media via Mobile Marketing Watch)
Mobile content and access had revenues of $39.17 billion in 2011, up 27.8% from 2010. Of that $39.17 billion, business accounted for 58% of the total and consumer for 42%. (PQ Media January 2012 via MarketingProfs)
Online social media was the smallest sector of mobile and social media during the year, reaching $2.83 billion in revenues, but the category grew at a very strong 42.1% year over year. Within the online social media category, social networking was the largest and fastest-growing segment by far, increasing 45.9%, to $2.28 billion in 2011. (PQ Media January 2012 via MarketingProfs)
From 2006 to 2011, mobile and social media revenue rose at a compound annual growth rate of 28.7%. (PQ Media January 2012 via MarketingProfs)
Total US mobile and social media revenues-including business and consumer content, access, and advertising and marketing-reached $45.38 billion in 2011, up 30.2% from a year earlier (PQ Media January 2012 via MarketingProfs)
Mobile CommerceMore than half of the U.S. smartphone population used their phone to perform retail research while inside a store in 2011 (comScore 2012)
79% of smartphone users use their phones to help with shopping and 74% make a purchase as a result (Google/Ipsos 2010)
More than half (52%) of adult cell phone owners used their devices while in a store to get help with purchasing decisions. (Pew 2011 via MediaPost)
It takes over 10 sessions with an app for 44% of eventual buyers to make their first purchase. Only a third (33%) buy in 2 to 9 uses of an app. And only 22% actually accept an upsell opportunity the first time in the door (Localytics via MediaPost January 2012)
Overall, about a third of cell phone owners used their phone within the past 30 days to look up either product reviews or prices online while in the store. Of them, 35% decided to purchase the item in the store, while 19% decided to purchase the product online and 37% opted not to purchase the product at all. (Pew Research Center via MediaPost)
Mobile payments are expected to quadruple to $630 billion by 2014 (Juniper Research)
42% of mobile users browsed products, 32% read online reviews, and 23% purchased products on mobile in the last 30 days (Nielsen Smartphone Analytics December 2011)
39% of store walkouts, where consumers leave without buying, were influenced by smartphones (Motorola Solutions)
Mobile and TravelMobile was responsible for US $2.6 billion in travel booking value in 2011. By 2013, than number is projected to exceed $8 billion, representing 2.6% of all U.S. travel bookings and 6.5% of the total online travel market. (PhoCusWright January 2012)
Mobile Marketing GrowthTotal US mobile and social media revenues-including consumer and business access, content, advertising and marketing-is expected to grow 30.8% year over year in 2012 (PQ Media January 2012 via MarketingProfs)
Mobile advertising and marketing was the fastest-growing sector in 2011, expanding 53.7% year over year to $3.39 billion with the ad segment soaring 60.9% and the marketing segment expanding 46.2% during the year (PQ Media January 2012 via MarketingProfs)
(Mobile) AdvertisingFacebook delivers 1 of every 4 online display ads (comScore 2012)
The global mobile ad market will grow from $3.4 billion in 2010 to $22.0 billion in 2016 (Berg Insight via B2B)
40% of males ages 18 to 29 like mobile ads “somewhat” or “very much” (eMarketer)
US mobile ad spend to reach $2.6B in 2012 (eMarketer)
Tablet owners more likely to purchase from online ads than smartphone owners, also more likely to request coupons from merchant (Nielsen)
Text message and online display ads have the lowest consumer trust (26% and 27%, respectively), while websites and TV have the highest (52% and 46%, respectively). (Nielsen)
Social Media & General Marketing36% of tweets are worth reading, 39% are mediocre, and 25% are not worth reading at all (MarketingProfs March 2012)
21% of Pinterest users purchased a product after seeing a picture on Pinterest (PriceGrabber 2012 via MediaPost)